Network Monitoring and Network Management
Open Source Tools - An Overview
Net-SNMP, Cacti, Nagios, SNMPTT, and Puppet
CHUUG - March 27, 2007
Max Schubert (a.k.a.
perldork)
Two Types of Information We Care About
-
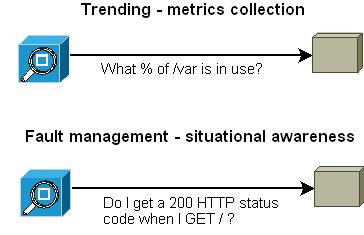
Fault management data - heads-up situational awareness
- Web server is offline
- SMTP server is up but not accepting email
- DNS server is taking too long to respond
-
Trending data
- Web server X's RAM utilization is increasing by
10% every month on average
- Number of concurrent database sessions on MySQL instance
Y appears to be remaining constant over time
Two Ways We Monitor Devices
-
Agentful
- SNMP
-
Custom / proprietary
- Nagios NRPE agent
- Zabbix host agent
- Agentless
- Network checks
- Is TCP port 80 open on host X?
- Is router N responding to ICMP ECHO (ping)?
- Application checks
- Use HTTP protocol to check retrieval of a web page
- Use SMTP protocol to test sending email
SNMP - Simple Network Management Protocol
http://www.simpleweb.org/
- Security must be a top priority when using SNMP
- UDP-based protocol
- Implemented by many hardware and software vendors
- Well-defined and documented
-
Three types of messages
- SNMP get requests (used by node managers to poll agents))
- SNMP set requests (used to change an agent/devices' state)
- SNMP traps (sent by an SNMP-enabled device to an SNMP manager)
- Three versions of the protocol in use: v1, v2c, and v3
-
With SNMP v1 and v2c, there are two primary roles
- Read-only role
- Read-write role
- SNMP v3 adds encryption and flexible role definition
SNMP GET and Polling
- The SNMP GET request is used by network management programs
to query (poll) an SNMP agent for data
-
Polling is generally used for trending
-
How much of resource R is in use right now?
- Disk space
- RAM
- CPU
- Network interface utilization
SNMP Traps and Fault Management
-
Traps are generally used for fault management
-
SNMP agent sends message to Network Node Manager
- Disk nearly full
- Power supply has failed
- Application specific
SNMP - Versions and Security Considerations - v1 and v2c
A community string is a plain text password. Only use v1 and
v2c with trusted users in trusted security zones.
-
SNMP v1 - first RFC in 1988
- Supports community string for polling, but not for traps
- Do not use unless device supports only SNMP v1
- Very lightweight
- Most insecure
-
SNMP v2c
- Supports community string for polling and traps
- Expanded data types over SNMP v1
- Added get bulk requests to request a large number of
OIDs at once
- Nearly 100% vendor support
- Allows for community string in both traps and polling messages
SNMP - Versions and Security Considerations - v3
-
SNMP v3 - Internet STD as of 2004
- Main focus was on overcoming security shortcomings of SNMP
v1 and v2c
- Not 100% vendor adoption yet or 100% implementation of all
aspects of SNMP v3 yet
-
Supports encryption
- MD5 or SHA data encryption
- Individual users can be created and managed
- Users can have passwords (authentication passphrase)
- Additional DES-encrypted privacy passphrase can be
used as well (optional)
-
Very flexible access control with views
- Custom views grant read or read-write to any OID or group
of OIDs
- Backwards compatible with SNMP v1 and v2 by including a
read-all and write-all role
SNMP - Security - Summary
- Only grant read-write to a device when absolutely necessary and
preferrably only in trusted security zones with trusted users
- Always use firewall ACLs to limit the flow of SNMP traffic into,
through, and out of networks
-
Protocol rules of thumb
- Do not use SNMP v1 unless absolutely necessary
- Only use SNMP v1 and v2c inside trusted network zones
- Only use SNMP v1 and v2c on LANs where the user-base is trusted
- Do not use SNMP v1 or SNMP v2c across untrusted WAN links
- Use SNMP v3 when you have to poll or receive alarms across a WAN
or other untrusted network
Net-SNMP
http://net-snmp.sf.net
Net-SNMP is an Open Source SNMP agent and suite of SNMP
tools. It is flexible, powerful, and available for Unix,
Linux, and Windows. The Windows port offers fewer features
than the *nix versions do at this time.
Advantages
- No licensing costs / open source
- Many programs available that use it
- Easy to extend with custom scripts
- SNMP v1, SNMP v2c, and SNMP v3 support
- Implements many SNMP standards
Disadvantages
Some important advanced features not stable yet
- Self-monitoring
- Historical polling
SNMPTT - SNMP Trap Translator
http://snmptt.sf.net/
SNMPTT is a perl-based Net-SNMP trap translator and filtering
framework. It ingests traps processed by snmptrapd (part of
the Net-SNMP framework) and does the following:
- Reformats the traps to be more easily read by people
- Persists the traps to a MySQL database
- Can execute custom actions based on trap contents
or type
- Very flexible filtering language with many printf()-like
formatting codes
- Fairly easy to set up
- Makes traps easy to process once it is in place
- Easy to integrate with Cacti or Nagios
Cacti - Open Source "Trend Anything" Tool
Home:
http://www.cacti.net
Forums:
http://forums.cacti.net/
Cacti is an open-source trending tool. It uses a
round-robin database utility and library called
RRDTool (
http://oss.oetiker.ch/rrdtool/)
to store data efficiently.
Cacti can be used to trend anything you can get data from with
a script. It also offers a wide array of plugins that extend
it's functionality to a much broader scope than just trending.
Cacti - Built-in Functionality - Trending
Trending
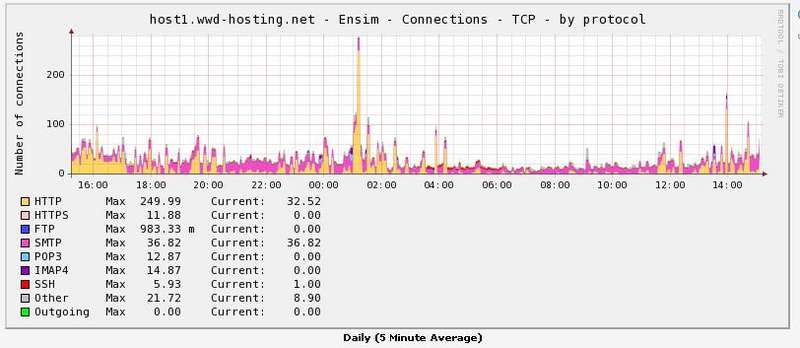
- Up to two years of data will be stored by default
- Default data rollup policies (all can be customized):
- Daily - 5 minute averages
- Weekly - 30 minute averages
- Monthly - 2 hour averages
- Yearly - 1 day averages
- Very efficient storage. One RRA (Round Robin Archive)
file on a server of mine that stores data for a graph with nine distinct
elements is using only 400k of space on the server to store 15
months worth of data.
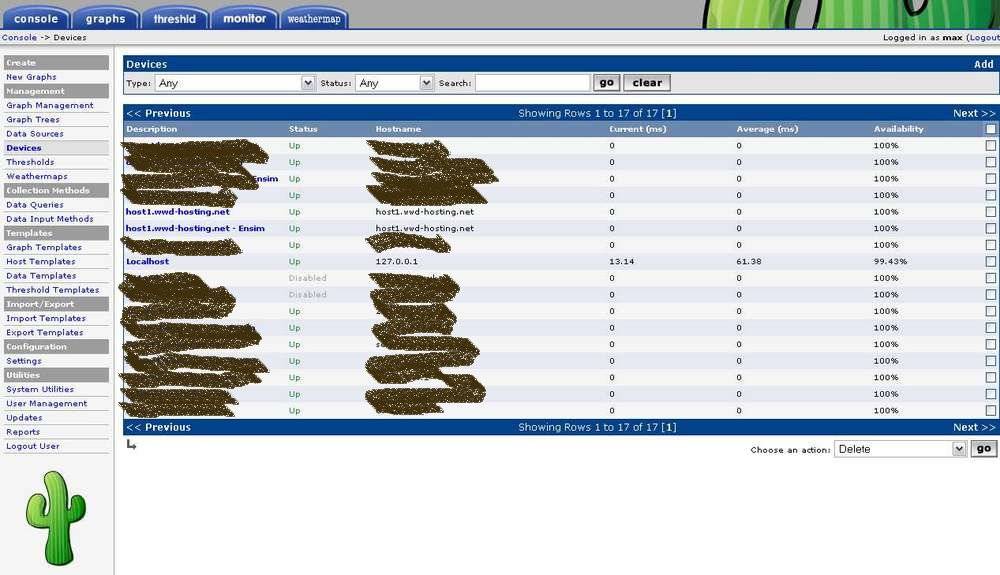
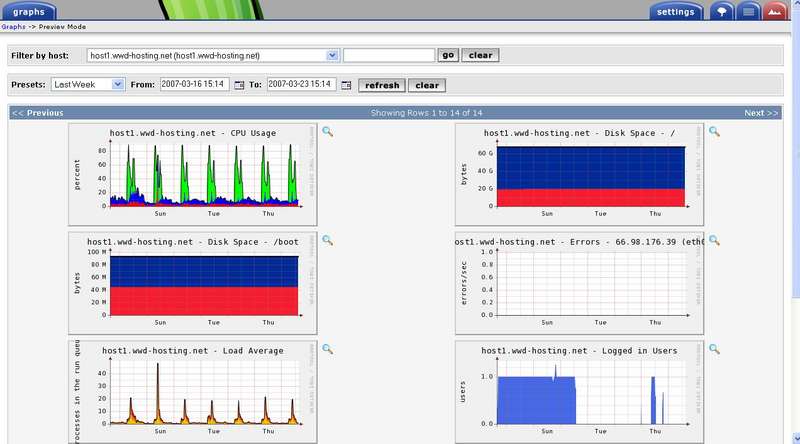
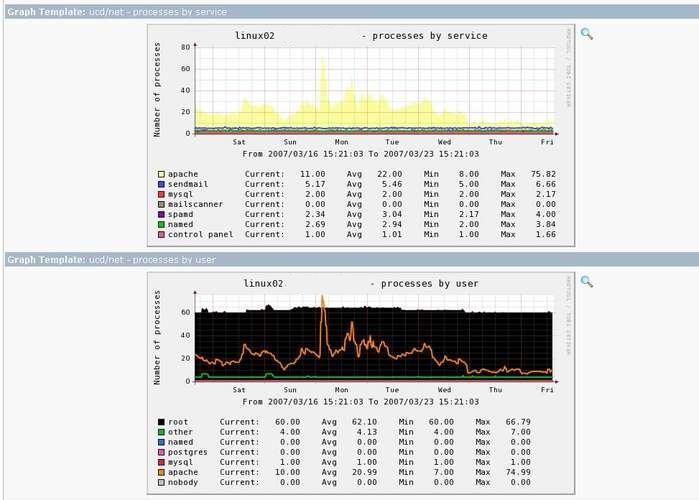
Cacti - Trending - Preview Mode
Cacti - Trending - Tree Mode
Cacti - Ingesting data into Cacti
- SNMP OIDs can be used without custom coding using Cacti's built-in
SNMP functionality
-
Scripts - Cacti can call local external scripts
- Easy to pass preset host variables or custom data to scripts
- Simple output API - just return space-separated name:value pairs
1min:10 5min:1 15min:3
-
Script server - Cacti can call PHP functions and cache the compiled PHP code
- Better performance than external scripts
- More complex to set up than external scripts
- Harder to test and debug than external scripts
- Very useful when monitoring large numbers of systems
Cacti - Ingesting data into Cacti - Data Input Screen

Cacti friendly output
bash$ perl /var/www/html/cacti/scripts/snmpg power-supply-failure
value:power-supply-failure count:18
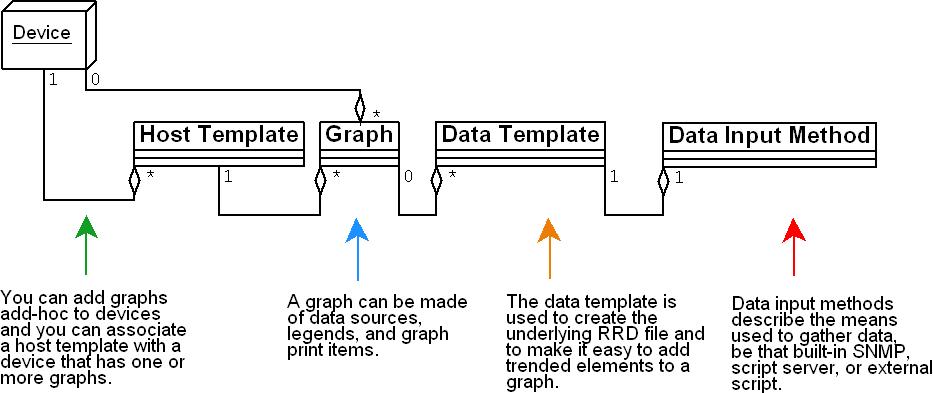
Cacti - Making graphs
- Create a data input method or use built in SNMP support
- Map data input method's output fields to a data template
(RRD file)
- Use one or more data sources from your data template in
a graph template
- Add one or more graph templates to a host template
- Add graphs to existing devices OR associate a host template
with an existing device to add all graphs in the template
to the host!
Cacti - Plugins and Addons
Cacti plugins and add-ons extend the functionality of Cacti
in a variety of different ways, extending it in some cases to be
much more than just a trending tool.
Primary plugin repository is
http://www.cactiusers.org
Cacti - Plugins - MAC Track
Easily track and search MAC address to IP address mappings on switches
in an organization.
- Add a device to MAC Track
- Poller will snapshot it every N hours
- You can search for MAC addresses across all devices
- You can see differences between snapshots
- Includes support for a wide variety of network devices
- You can add support for new devices fairly easily
Cacti - Plugins - THold
Cacti displays and emails alerts based on high / low threshold breaches for
any element you trend on with Cacti.
- Includes basic baselining support: THold can monitor the element
for N-hours/days and the highs and lows seen will be used as
the 'normal' limits for the device.
- Can do relative low and high thresholds based on baselined averages.
- Number of polls required to call an element threshold breached is
customizable on a per-threshold basis.
- Number of polls an element has to be back within acceptable bounds
to be considered out of fault state is customizable on a per-threshold
basis.
- Once a threshold is created, it can be easily applied to any device
that polls for the watched element.
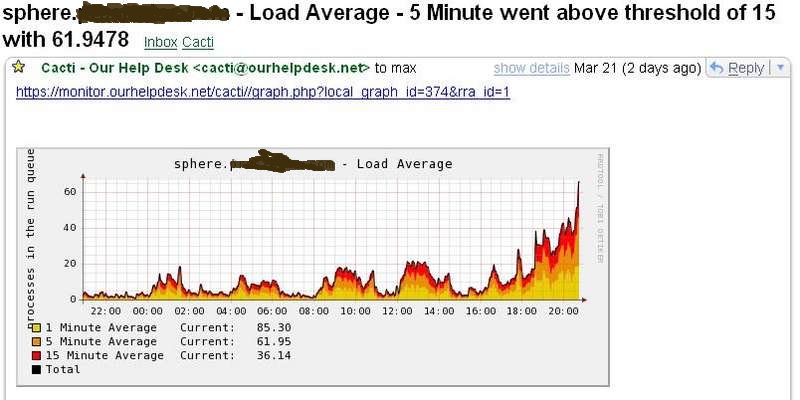
- Alert email includes graph of element performance for last 24 hours.
Cacti - Plugins - THold - Sample Email
Load average over threshold

Cacti - Plugins - Network Weathermap
http://network-weathermap.com/
Display bandwidth utilization between network devices on your networks
in an easy-to-read graphical format.
- You can create multiple maps for the various networks you manage.
- For each link you create, you define the maximum bandwidth for
the link; the weathermap will then show what percent of the
bandwidth for a link is currently in use and will also display
the current in/out bits/second rate for the link.
- Easy to use, stable web interface for creating maps.
Cacti - Plugins - Manage
Basic TCP service monitoring. Pretty GUI interface, you can group hosts
into logic groups, associate custom icons with devices. Useful if you
do not want to install a separate fault management tool.
http://gilles.boulon.free.fr/manage/
Nagios - Overview
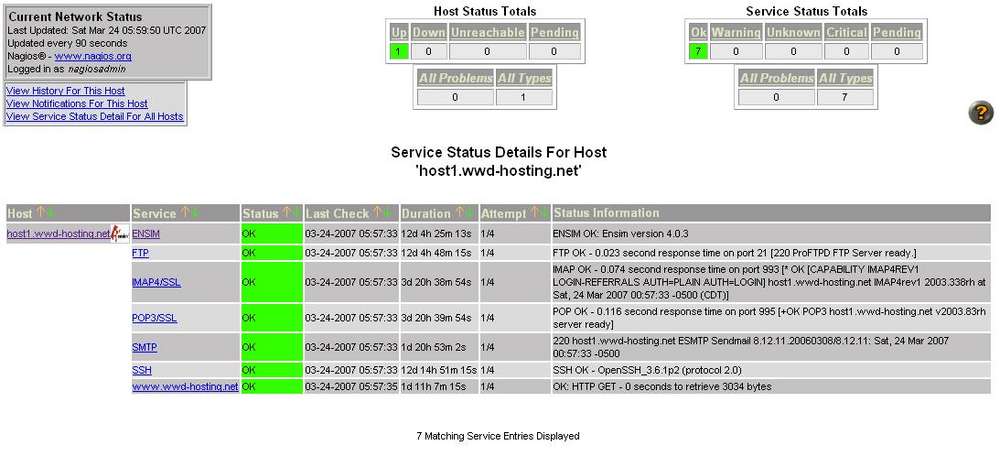
Nagios is a very flexible, extensible fault manager. It allows
administrators to easily create a visual map of their network and check the
status of any device or service that can be reached / checked with a script.
- Includes basic trend, alert, and availability reports
- Flexible notification, including schedules
- Flexible configuration - confusing to beginners
Nagios - Network visualization
Nagios allows administrators to create a living map of their networks.
Device icons change colors on the map as device statuses change.
- Device relationships are manually established.
- Easy to create with parent-child relationships.
- If a parent device goes down, children are marked as unavailable.
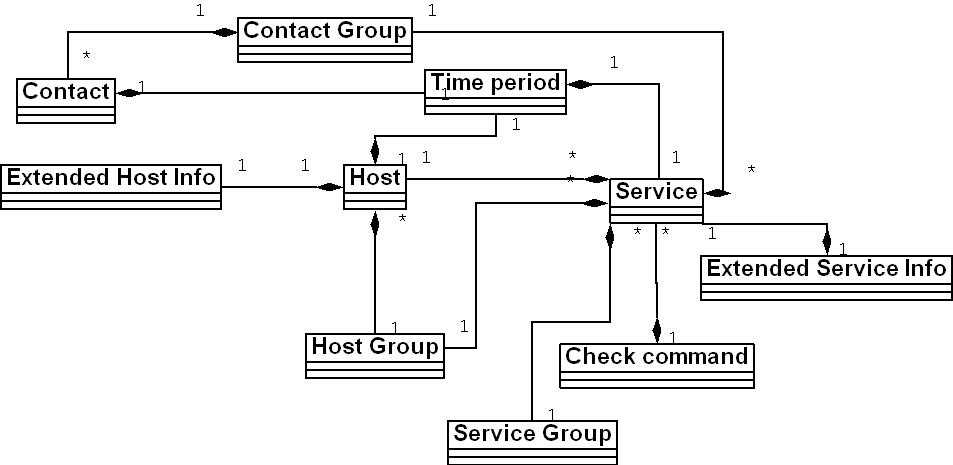
Nagios - Configuration Overview
- Very flexible configuration
- Great once you understand what you want to monitor and develop
a consistent host and service configuration and relationship style.
- Object-oriented
define host{
    use                     generic-host  ; Name of host template to use
    parents                 ev1s-66-98-176-1.ev1servers.net
    host_name               host1.wwd-hosting.net
    alias                   host1.wwd-hosting.net
    address                 66.98.176.39
    check_command           check-host-alive
    max_check_attempts      10
    notification_interval   120
    notification_period     24x7
    notification_options    d,r
    contact_groups  webeagle
}

define hostextinfo{
    host_name   host1.wwd-hosting.net
    notes           Web Wizard Design - web host
    icon_image      cp/ensim.jpg
    icon_image_alt  Web Wizard Design - web host
    statusmap_image cp/ensim.jpg
}
Nagios - Checks Overview
-
Host alive checks. Can be any check, not just ping.
- For a web server might use HTTP check.
- Can have dependencies. E.g. "do not check the status of
the CRM application if MySQL is not responding."
- Custom checks - simple API, has embedded perl interpreter as well
Example of communicating exit status
my $vers = ($header =~ m#(\d+\.\d+\.\d+)#)[0];

if ($status == 401 && $vers) {
    print "cPanel OK: cPanel version $vers\n";
    exit $ERRORS{'OK'};
}

if ($status != 401 && $vers) {
   print "WARN: cPanel version $vers: returned HTTP status $status, not 401\n";
   exit $ERRORS{'WARNING'};
}

if ($status == 401 && $vers eq '') {
   print "ERROR: GUI not available (expected content not found)\n";
   exit $ERRORS{'CRITICAL'};
}
Nagios - Checks Overview - Status Detail Screen
Nagios - Reports
Nagios offers a useful handful of built-in reports, including
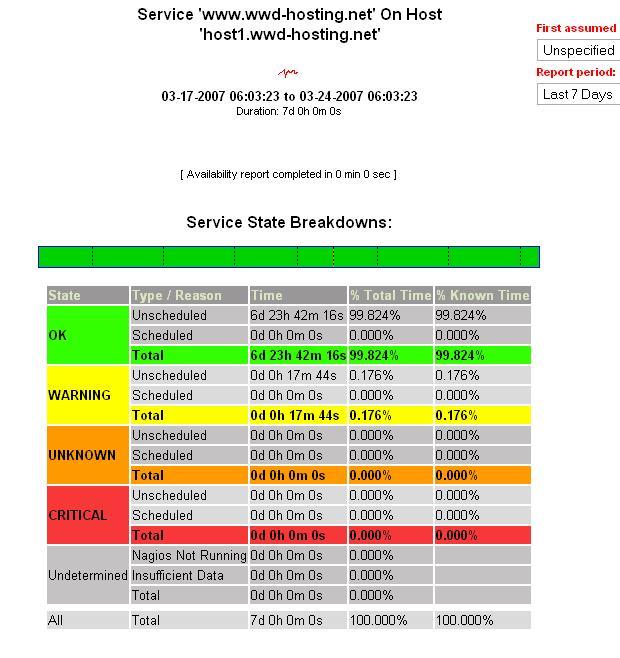
- Service and host availability (can be used as SLA report)
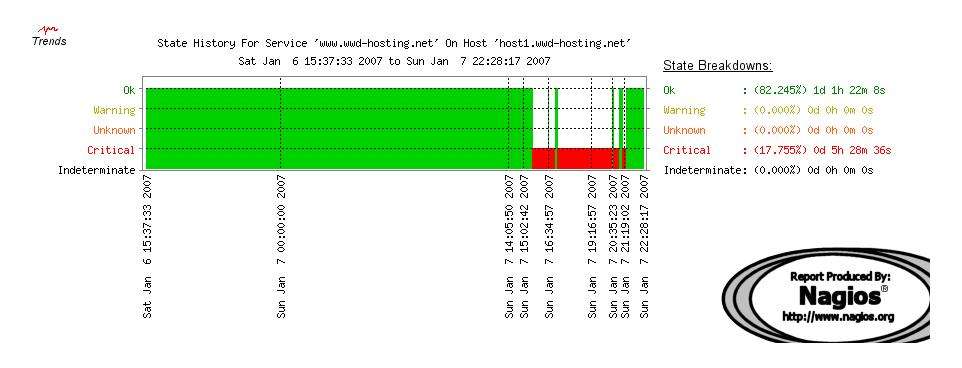
- Service and host trends
- Alert history and summary reports
- Recent notifications report - who was alerted when about what?
Nagios - Reports - Availability
Nagios - Reports - Trends
Nagios - Addons
http://www.nagiosexchange.org/
A wide variety of add-ons are available for Nagios. They extend
Nagios in many interesting and useful ways. Many are available for
download on the Nagios Exchange site.
- Configuration front-ends
- Visualization add-ons
- Database backends
- Device auto-discovery
- Trap integration
Nagios - Addons - Nagvis
http://www.nagvis.org/doku.php
Nagios visualization framework. NagVis can read data directly from the
Nagios CGIs or it can read from database tables created with
NDO (Nagios Data Out), a database backend plugin for Nagios that makes
use of the Nagios event broker framework.
- Supports multiple maps
- Will rotate through each map you create
- All maps created / edited from a web interface
- Sometimes hard to place items using the web interface, have to
resort to editing configuration files directly
Nagios - Addons - NagioSQL
http://www.nagiosql.org/wiki/Main_Page
NagioSQL is a web-based, graphical configuration front-end for Nagios.
Configuration data is written to a MySQL database and then written out
to Nagios configuration files. Stable program, last release was in 2005.
- Easy for novices to use
- Graphically displays some relationships between configuration objects.
-
Uses PHP for the GUI and Smarty, fairly easy to modify / change
how the GUI works to suit your configuration style / needs.
Nagios Addons - NagTrap
NagTrap displays data captured in a MySQL database, data is inserted into
the database
by SNMPTT (http://snmptt.sf.net/).
Includes a script that can send traps to Nagios as passive checks.
- Not very mature / SQL and GUI are definitely works in progress
- No automatic archiving of "old" traps
Puppet
http://www.reductivelabs.com/projects/puppet/
Puppet is a configuration management, system administration automation,
and system integrity tool. It runs on a wide variety of Unix and Unix-like
operating systems. Puppet uses a very flexible and powerful
configuration language that allows an administrator to describe managed
system configurations in a very readable, easy to understand format.
- Watches file permissions, modes, and contents
- Can replace file contents with "clean" copies of a file
or files when the contents change
- Watches and can replace users and groups
- Includes package management functionality
- Can manage cron jobs
- Can manage network interfaces
- Can manage zones (on Solaris)
- Can clean up files and directories based on age and size
- Can do anything you need it to do using custom 'exec' tasks
- Actions can be triggered when a managed file or other objects'
state changes.
- Can send change reports to a central server when state changes
or corrective actions are taken
Puppet - Framework Overview
- Based on Ruby On Rails
- XML-RPC used for client to server communication
- YAML used for portable representation of system state,
change reports, and configuration caching on Puppet
clients
- Uses SSL to encrypt client-server communcations
- Can also use encrypted passphrases for authentication
as well
Puppet - Portable
Runs on many flavors of Unix and Unix-like operating systems
- Redhat Enterprise
- Fedora Core
- Debian
- Solaris
- FreeBSD
- AIX
No port to Windows yet (hoping this will happen soon)
Puppet - Configuration Management
For all the items listed here, can also watch to make sure items
do not exist.
-
Watches files and directories
- Permissions
- Mode
- Owner
- Group
- Checksum (MD5, timestamp, SHA)
- Contents
-
Watches links - can ensure that they point to the right destination
-
Can watch network interface configurations and states
-
Can watch cron job contents
Puppet - Example configuration snippets - Exec With Notify
Rebuild /etc/aliases when it changes
class mail_files {

  file {

    "/etc/mail/aliases":
        source => "puppet://$fileserver/all/etc/mail/aliases",
        ensure => file, owner => root, group => bin,
        checksum => md5, mode => 644;

    "/etc/aliases":
        target => "./mail/aliases", ensure => link;
  }

  # Rebuild the database, but only when the file changes
  exec {
     "/usr/sbin/newaliases":
        subscribe => file["/etc/mail/aliases"],
        refreshonly => true;
  }

}
Puppet - Example configuration snippets - Tidy Task
Remove Tomcat log files that are older than 60 days
class tomcat5 {

    tidy {
        "/usr/local/tomcat5/logs":
            age => '61d',
            recurse => true,
            path => '/usr/local/tomcat5/logs',
            type => ctime;
    }

}
Puppet - Example configuration snippets - Custom Task With Exec
Remove any build tar.gz files that are older than 3 days, run when
/usr/local/myapp changes
file {
    '/usr/local/myapp':
      checksum => md5,
      ensure => directory,
      mode => 755,
      owner => root,
      group => root
}

exec {
  "ruby -e 'Dir::glob(%q{/usr/local/myapp/*.tgz}) { |f| File::unlink(f) if File::
ctime(f).to_i < (Time::now() - (60*60*24*3)).to_i'":
  path => '/usr/local/bin:/usr/bin:/bin',
  subscribe => file['/usr/local/myapp'],
  refreshonly => true
}
Puppet - Sample initial setup workflow
- Client connects to server after initial install and
requests server sign clients' SSL certificate
- Server administrator signs client certificate using
puppetca command.
- Server sends client the clients' full configuration
- Client caches configuration in YAML format
- Client does an initial run of all configured tasks
- Client checks for configuration file updates on the puppet master
server every 30 minutes (by default)
- Typically, corrective actions for managed system objects that change
to unwanted states are made within 60 seconds of the change
Puppet - Missing / incomplete features
- Does not have a web-based GUI to display and manage configurations
- Does not have a web-based GUI to display and search reports
- Version 0.22.1 has problems with runaway processes when puppetd
is run in --listen mode
Open Source Fault Management / Trending Alternatives Worth
Investigating
The number of open source projects focused on network fault management
and trending is growing very rapidly. The programs I gave an overview
of here are just a small sampling of the programs available. Here
are a few others you might want to check out.
Worthwhile Commercial Solutions
- Spectrum - fault manager - ~ $80k per instance
- eHealth - network trending, system trending, notification management,
custom alerting ~ $70k per instance
- SysEdge system agent - very extensible commercial SNMP agent
~ $1k per instance
- HP Openview - fault management - starts at ~ $9k, to get same
functionality as Spectrum you will end up spending over $100k


